Connect With Us

Stay Connected
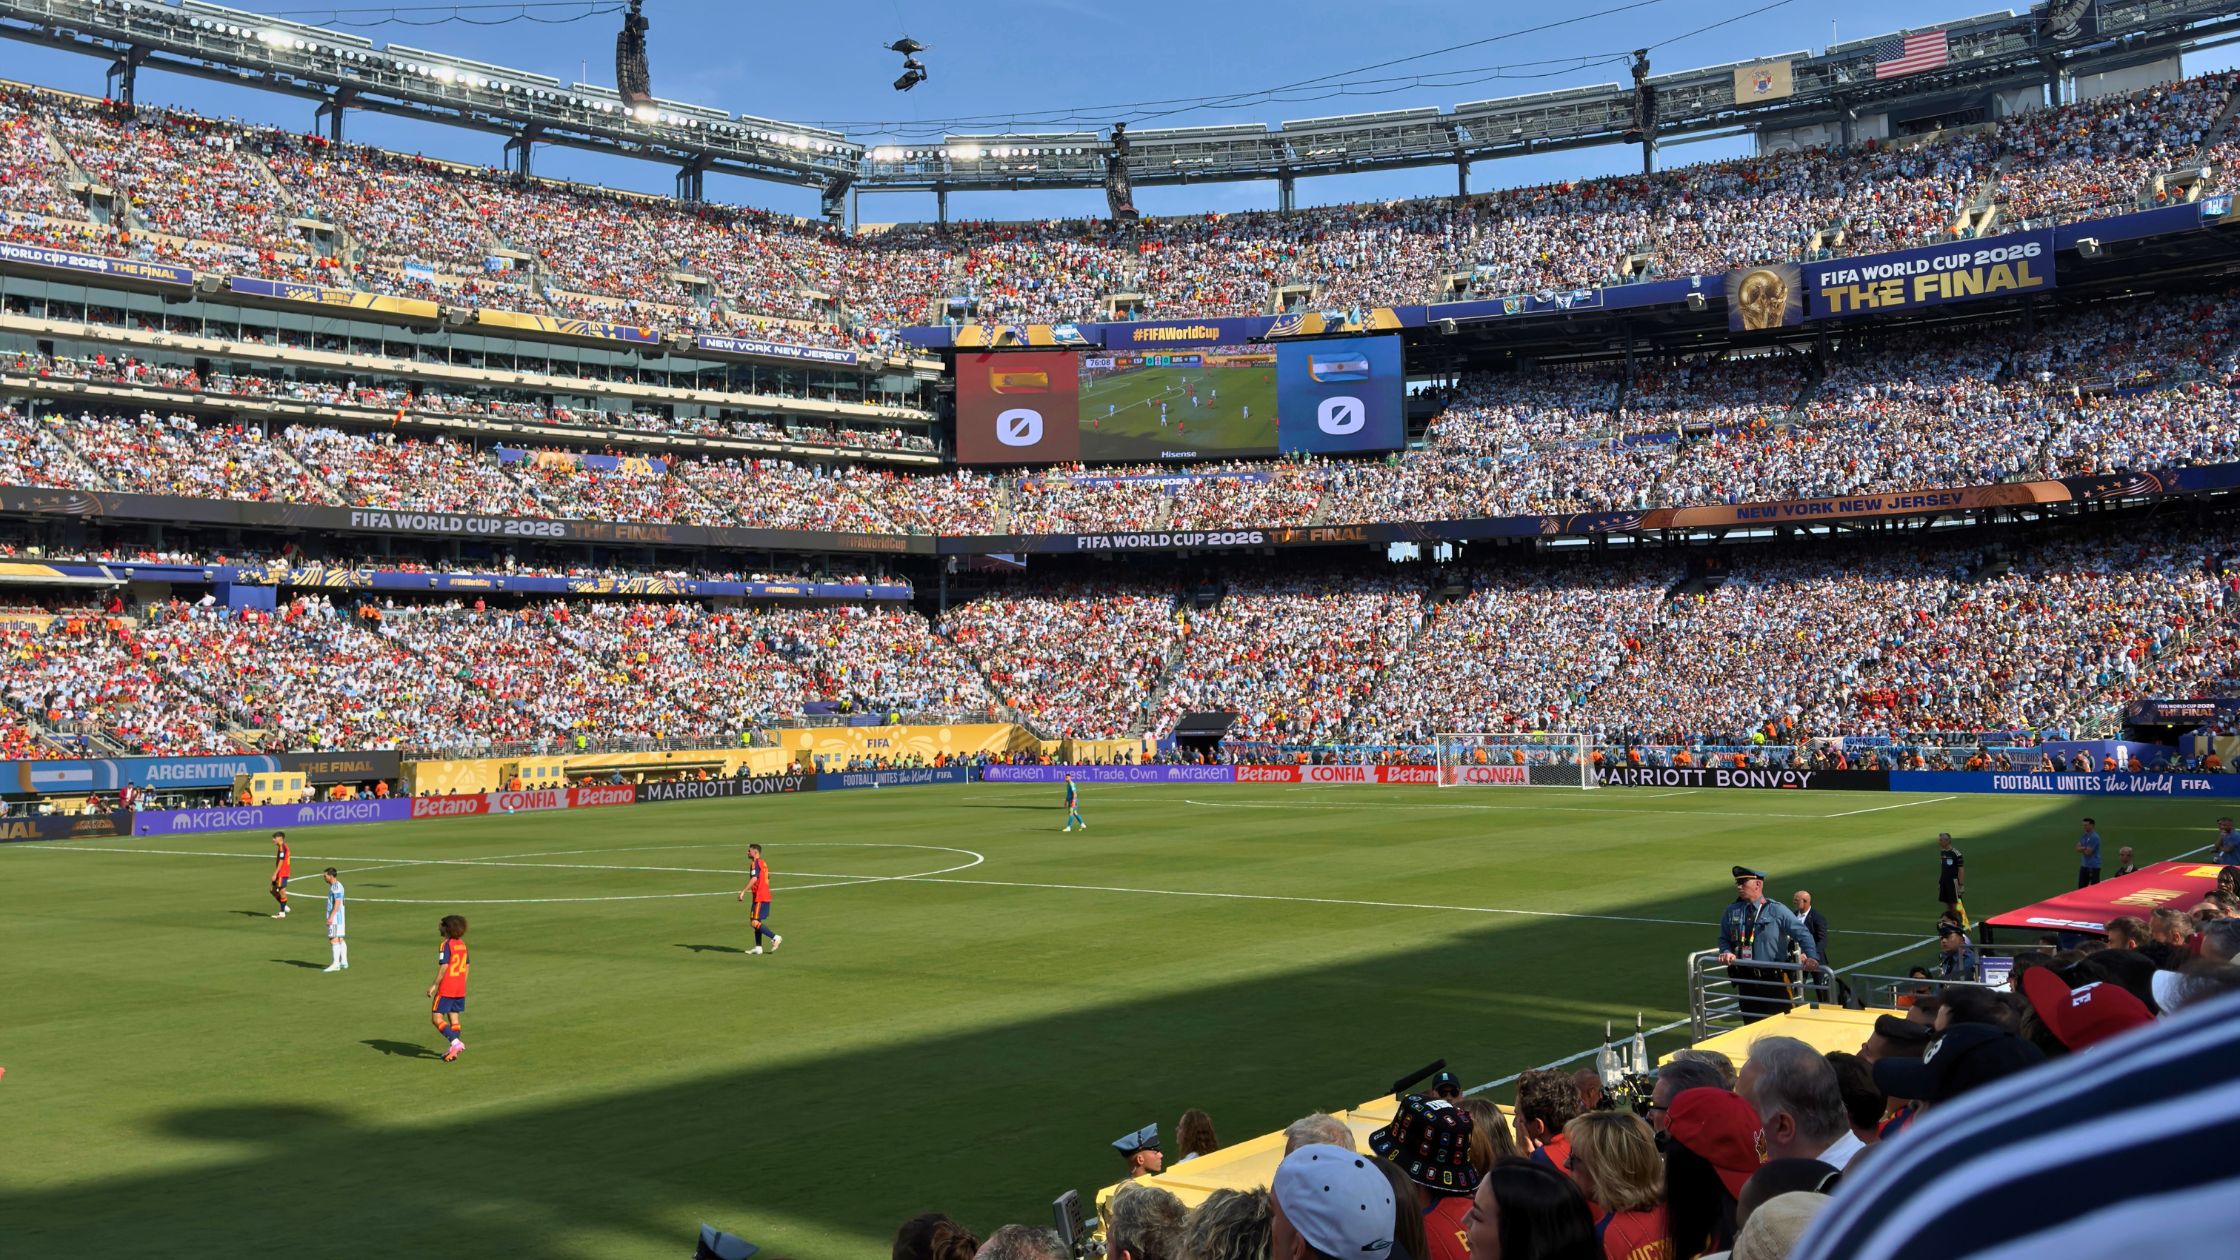
From providing technical support in Canada to greeting guests at the final match, FDU students and alumni volunteered and worked for the 2026 FIFA World Cup. ⚽![]()
![]() Learn more here: whatsnew.fdu.edu/fduworldcup
Learn more here: whatsnew.fdu.edu/fduworldcup
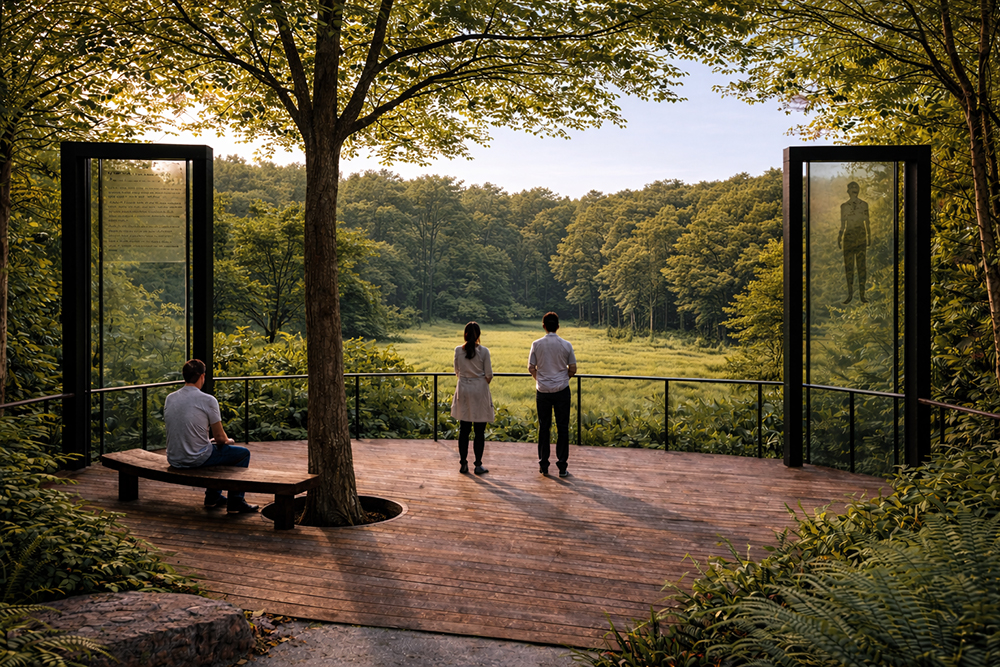
FDU looks good everywhere, even at the beach 🌊![]()
![]() 📸 Mendy Ross
📸 Mendy Ross
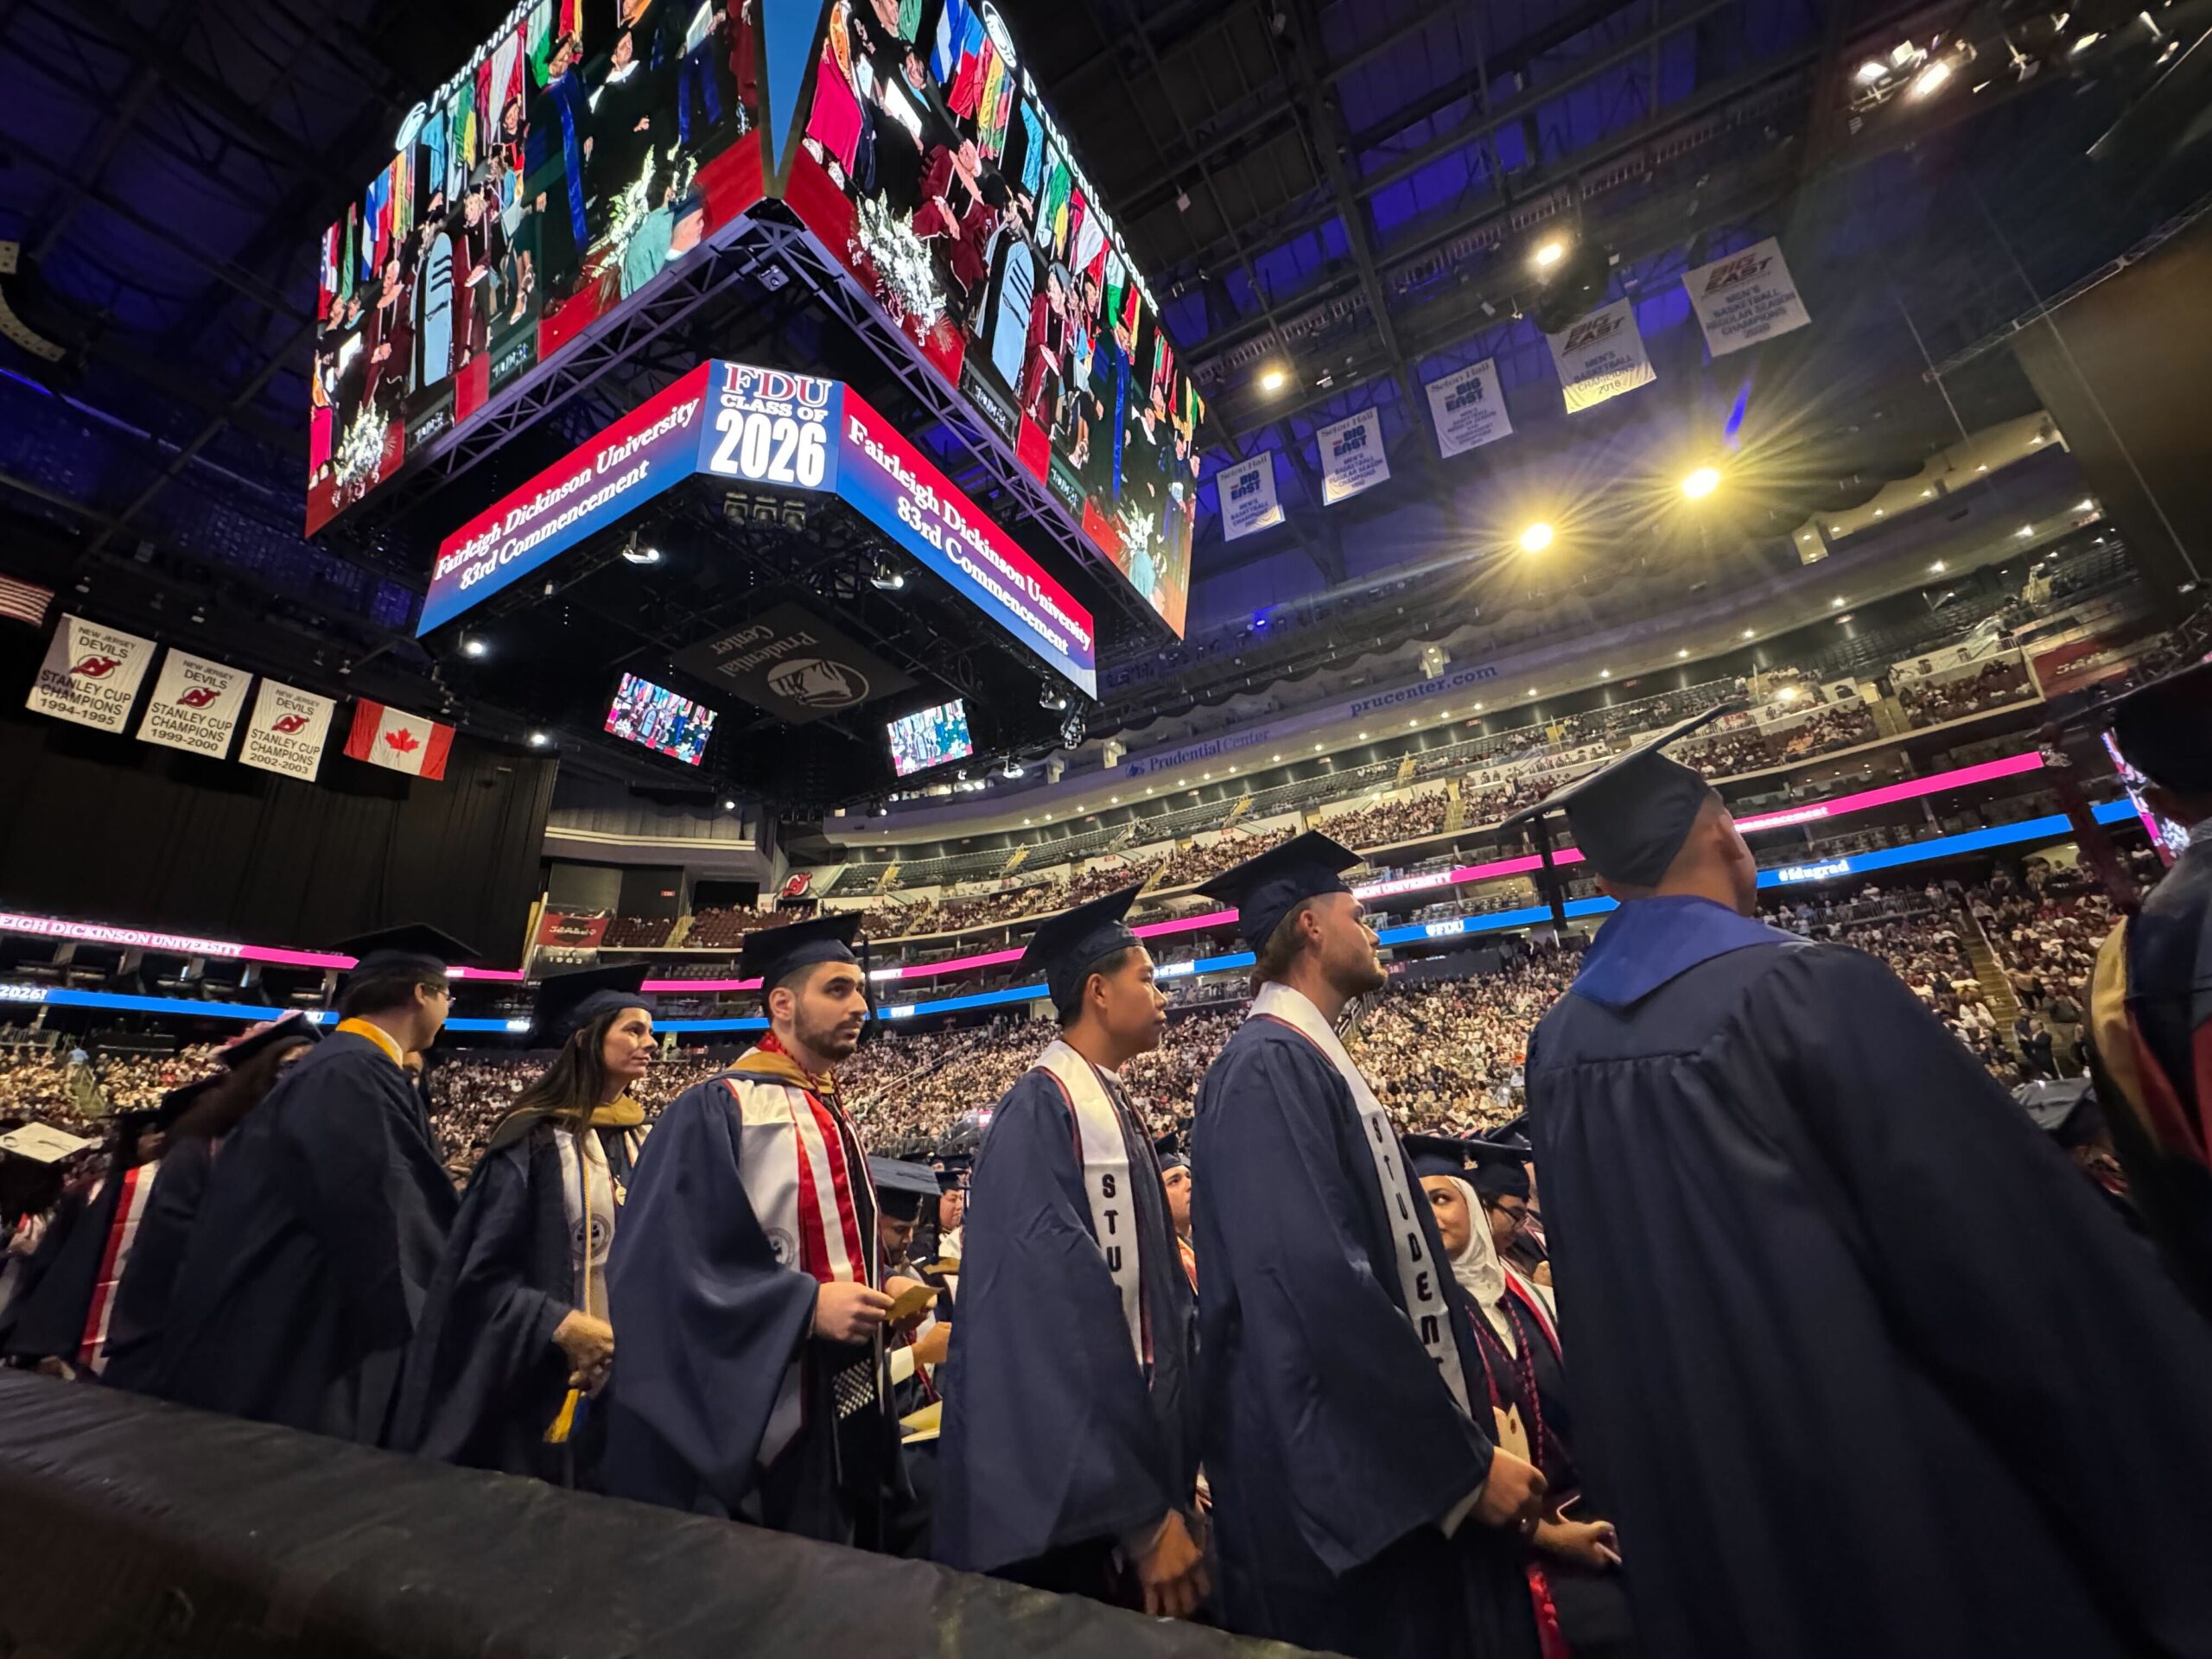
FDU and Raritan Valley Community College have launched a new articulation agreement, giving RVCC students a clear path into FDU's PharmD program.![]()
![]() Learn more here: whatsnew.fdu.edu/4pReCST
Learn more here: whatsnew.fdu.edu/4pReCST
@FDUWhatsNew
See More on Instagram
